Innovation Series

Realistic Synthetic Data at Scale: Safely Using Production Data to Generate Models

Mehul Sheth, Sr. Principal Engineer

“But the lab results were promising! We could handle more load than this in our test environments!”

No one wants to hear such excuses after a production issue. Actually, no one wants a production issue in the first place! One of the many reasons for leaking defects to production is the poor quality of test data. If the test data is not representative of production data certain edge test cases are missed, the behavior of the product in production differs from expected behavior, and this may result in outages or data loss. This blog describes the process of generating realistic synthetic data at scale influenced by production data, highlights the challenges in generating meaningful data, and how these challenges were overcome at Druva.

Druva offers 100% SaaS data protection and management as a service. Our products handle petabyte-scale customer data and ensure that our products scale in production based on their needs. This blog details our approach and also explains the thought process behind the decisions taken so you can get a glimpse of our journey along with the final outcome. At the end of the blog, you will be able to understand how to create a machine learning model around the production data without exposing it and implement it to generate synthetic test data; production-like, realistic, and at scale.

Process

Process

Fig. 1: Process 


As shown in Figure 1, the characteristics of data that impact the product behavior were identified, i.e. the criteria which need to be studied such as the size of files being backed up, the name of the file and its path, etc. Then, we analyze the production data and create a model based on the criteria identified. This model was used to generate data at scale.

Taking a peek at prod data, will we create a fancy model and will generate test data based on this for ages to come? No! This process is a continuous one, we’ll need to analyze prod data at reasonable intervals and update our model. This interval can be time-based like once a month or quarter, or sporadically like when a new significant client is added or when the business seems fit to update.

Outcome

As a result of these efforts we saw the following key results: 

  1. Better insights into how our customers use our products, what type of data they back up (of course with customers' data privacy as our top priority), and how they access this data. For those who could improve the use of our products, we raised action items to proactively help these customers or change policies, etc. 

  2. Better architectural decisions based on production findings rather than assumptions. Decisions included optimized storage for certain file types, i.e. videos, as video content in our customer data has grown significantly. In addition, software-imposed checks or limitations can be introduced to avoid exploitation of the product.

Production Data Modeling

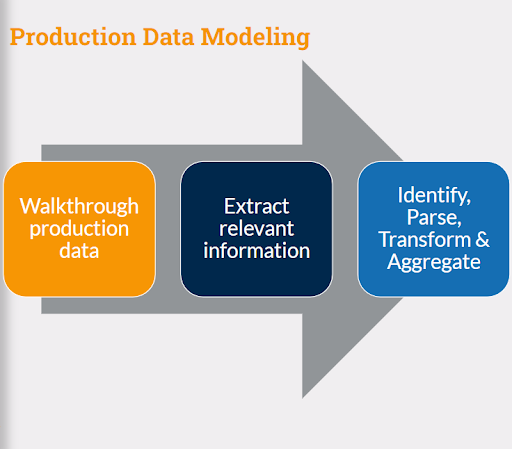
Production data modelling flow chart

Fig. 2: Production Data Modeling


The major challenge in mining production data was how to get access without breaking legal contracts with customers. In this implementation, no customer files were opened even in code. Code only reads meta-data, such as file size and extensions. The next challenge was to select "enough" data and scale the sample to extrapolate key findings. 

An example of scaling could be if a new prospect wants to back up a Google shared drive with a TB of data — but production has so far only observed a maximum drive size of a few hundred GBs. How do we generate 10x of this observed production load?

Data points

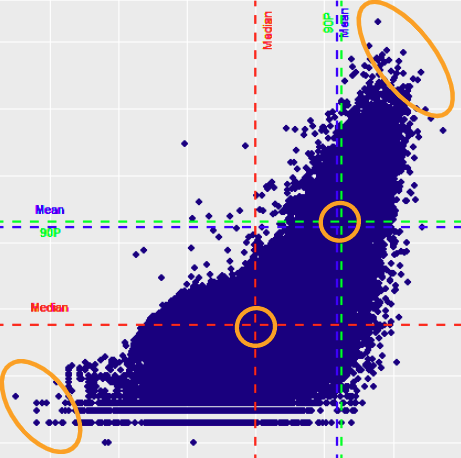
Fig 3: Sample Selections based on Statistical Criteria


The first step is to identify which data needs to be parsed. Each blue dot in the image represents a folder or file system. The X-axis denotes the total size of the entire dataset and Y denotes the total number of files in that set. It is observed that, as the total data set size increases, the more files are in it and the range of total files also increases. Four points from this plot were selected, as highlighted — some from around the median, some at 90% on both X and Y, and the two extremes.

Density plot

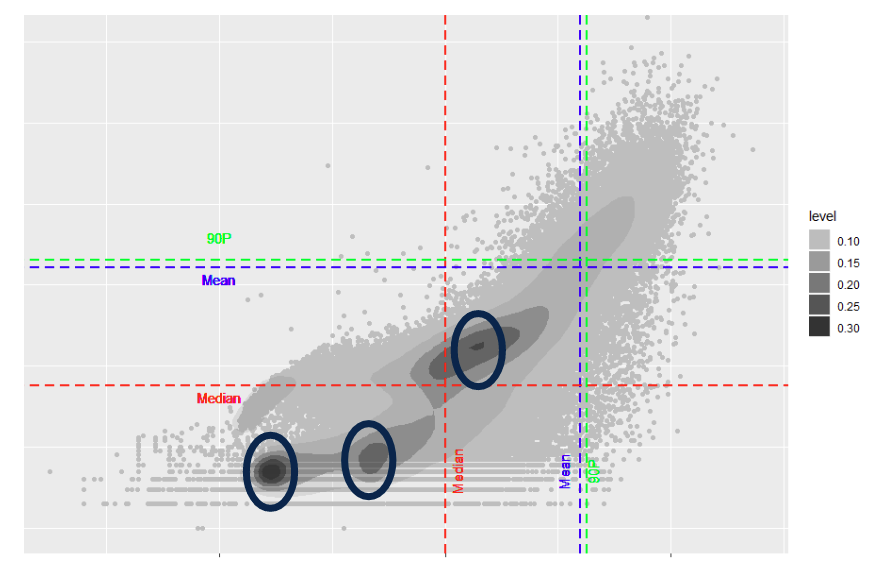
Fig. 4: Density plots


On a 2D density graph, three more spots of interest were observed. The darker area shows where more sets are concentrated and where the majority of data points lie (the mode of the data). A few samples from around these seven areas were selected, we read the metadata and created a model for all the criteria that are important to us.

DIRS_PER_DIR = {0.5:(0,1),…}

FILES_PER_DIR = {0.2:(0,3),0.5:(3,5),0.75:(5,12)…1:(60,401)}

Fig. 5: Dictionary representation of sample features of our model


For example, files per directory are read as 20% of directories in our data set will have between 0 and 2 files; 30% (point 5 minus point 2) between 3 and 4; 25% between 5 and 11… and a max of 400 files per directory.

Sample features

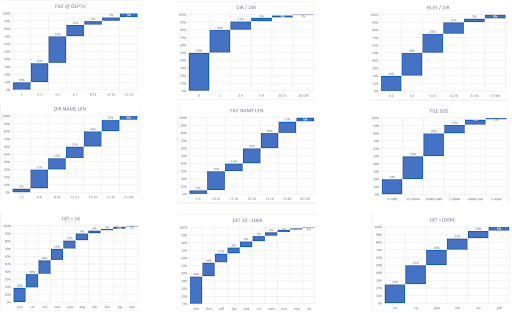
Fig. 6: Sample features - Visualization


If you observe closely, most of the small files are text-based like JSON or text (even binary files like png can have a small size) and the large files are all binary. Look into the middle bucket, it is a mix of text files like CSS, JSON, and binary like pdf and xlsx.

Look at this plot of files at a given depth — 10% of the files were at depth of 1 and only 5% of the files were at a depth greater than 15. Similarly, it is seen that half the directories have no subdirectories and 96% of the directories have less than 9 subdirectories.

The model is used to generate arrays with 100 files for simplicity, which will get 5 files at a depth of 15 (minimum). Now, fitting the other models of files per directory and directories per directory, it is very unlikely that there will be any directories at depth 15, so we will need to tweak the distributions slightly where at least one subdirectory at level 10 has 10 files in it (accounting for the last two buckets combined). The code makes such modifications at runtime and comes up with an output that best matches the distribution in the model. It takes more iterations to come up with this balance for smaller data sets and it takes more time per iteration if the data set to be generated is larger.

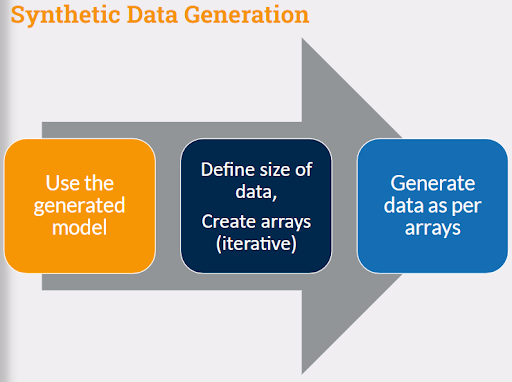
Synthetic Data Generation

Synthetic data generation

Fig. 7: Synthetic Data Generation


Now that we have a model in place, we want to generate data mimicking production for a new feature release, for example, to move data to a different storage model. The requirements also mention that since this model is offering storage at a very cheap price, it is expected clients will store more data here and it will need to be tested with 2x production load.

  1. You start with deciding the size of the target filesystem, this is the input to the code

  2. The code divides the total size into files of different sizes fitting the distribution

  3. Depending on the total number of files, the directory distribution is defined, that is total directories at each level

  4. Files are distributed in these directories 

  5. File names are generated

  6. Extensions are mapped to the files

At each step, arrays are validated. If validations fail the process repeats itself and modifies the input model.

Finally, the best-fit arrays are chosen to be passed to the next step i.e. data generation.

These are a few algorithms that were explored and applied for data generation.

Text generation

Random text

This is a very simple and fast approach — random text is generated from ASCII characters. The disadvantage is that the data is garbled — it doesn't make sense and isn’t meaningful words you can generate like the examples in bold. The advantage is you can very accurately control the size of data that you need (useful for generating file names).

Obfuscated using Caeser's cipher

This is also simple and fast, however, you will need a corpus set, i.e. a selection of words of different lengths. If you want a word with three characters and from your bag of words you select "MAN" and shift each character by three, then MAN becomes P-D-Q; ZEBRA becomes E-J-G-W-F with a shift of five. This way you weakly protect the original corpus as it is very easy to guess the original word even if you don't know the shift for a limited vocabulary. However, if your corpus is public data, you need not spend time even applying the cipher, simply select the words from the bag which match the size.

Statistical model

If you have a large corpus of words, you can parse it and save the distribution with probabilities. Example:

  • Corpus: THE, THIN, THIS (only 3 words for simplicity)

Prediction:

  • 1st Character: T (100% Probability)

  • 2nd Character: H (100% Probability)

  • 3rd Character: E (33% Probability) or I (67% Probability)

  • 4th Character: - (33%) or N (33%) or S (33%)

Possible predictions: THE, THI, THEN, THIN, THES, THIS 

Some of the predictions (highlighted in bold) could be not from the corpus and may be non-dictionary words like “THES.”

Markov chain

The last algorithm implemented is similar to the previous one, with the exception that if the third character is selected as I, there will be a fourth character which will be N or S with 50% probability. Again the implementation is based on words, not characters. 

Also, there are three variations of the algorithm — Unigram is a one-word sequence; bi-gram is a two-word sequence; trigram is a three-word sequence. Unigram does not depend on the previous word. For example, “statistics” is a unigram (n = 1), “machine learning” is a bigram (n = 2), and “natural language processing” is a trigram (n = 3). If the combination selected doesn’t match any known pattern, you select random words. The same approach is used to initialize the chain. These algorithms are for textual matters, like notepad files or file or directory names.

For binary data, i.e. files like videos, images or .pdf

Random bytes are generated and packed into the file of a desired size and compression is controlled by selecting the range of random numbers — it is a simple but really effective solution. Range and compression have an inverse relationship, i.e. the higher the range, the lesser compression ratio you get.

Conclusion

In order to have production-like test data, relevant characteristics that impact product behavior were identified. These were analyzed from production and modeled. The model was then used to generate test data for lower environments. The data sets were used in feature testing, scale testing, and performance testing.

Based on the use case in different industries and problems, similar characterization of production workloads can be executed to better test data and generated based on production data.

Next Steps

Learn more about the technical innovations and best practices powering cloud backup and data management on the Innovation Series section of Druva’s blog archive.