News/Trends, Tech/Engineering

Machine Learning to Detect Anomalies from Application Logs

Adwait Bhave

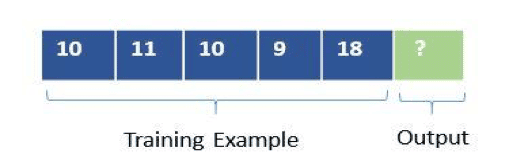
Much of the massive amount of data today is generated by automated systems, and harnessing this information to create value is central to modern technology and business strategies. Machine learning has emerged as a valuable method for many applications—image recognition, natural language processing, robotic control, and much more.

Download White Paper: Public Cloud Backup Delivers More for Less

By applying machine learning to system-generated debugging logs, we’ve gained key insights and transformed these logs into critically valuable data sources.

Existing Monitoring: Manual Thresholds

Most software products generate logs that are used for root-cause analysis and troubleshooting. Though these logs offer useful insights into real-time performance, mining them for actionable knowledge is challenging. The data they contain lacks structure, and often, they simply don’t contain enough analytical information.

Software as a service (SaaS) solutions present even more difficulties. Cloud operations teams must monitor the logs in real time, in addition to the numerous other data streams under their watch.

Typically, monitoring teams are tasked with:

  • Identifying and alerting if any part of the service is not operating as expected.
  • Looking for signals that indicate imminent cascading failures.
  • Understanding how normal cycles of operations shift during upgrades, patches, and hotfixes.

Traditionally, teams and developers monitoring cloud operations depend on their past experiences with the systems, as well as certain manually defined rules, to detect anomalous behavior. However, rule-based monitoring is convoluted and isn’t scalable. The complexities of modern systems with multiple components in a dynamic business environment make it difficult for a single team to see and understand all of the patterns. In addition, these static, manual rules often fail to catch anomalies, creating false negatives—or even worse, they trigger alerts about anomalies when there are none, creating false positives.

At Druva, we wanted to develop an efficient way to detect anomalies as quickly as possible. Rather than relying on product knowledge and manually set thresholds to detect anomalous behavior, our goal was to leverage technologies that learn the complex patterns, account for seasonality, and perform with better precision than manual systems.

Deeper Look At Anomalies

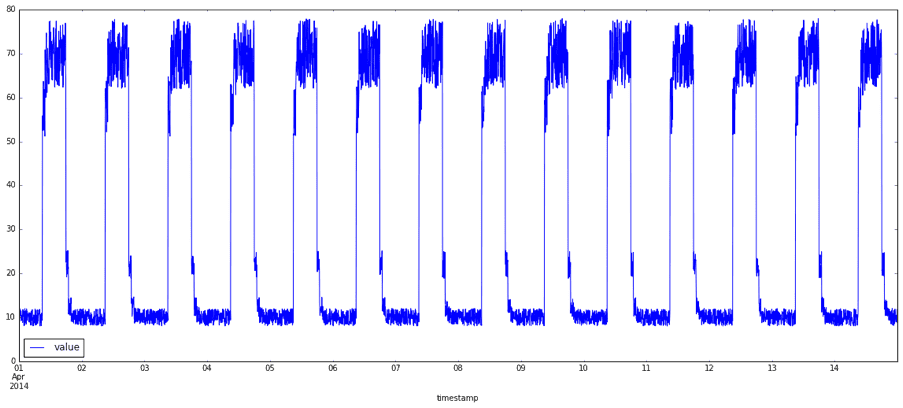
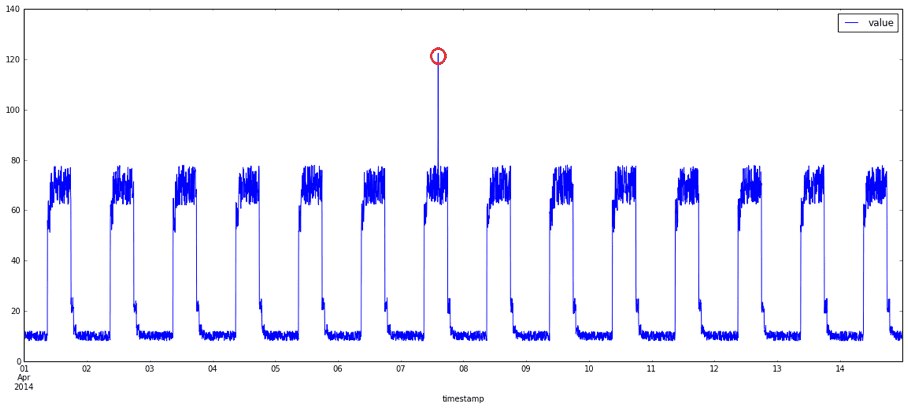
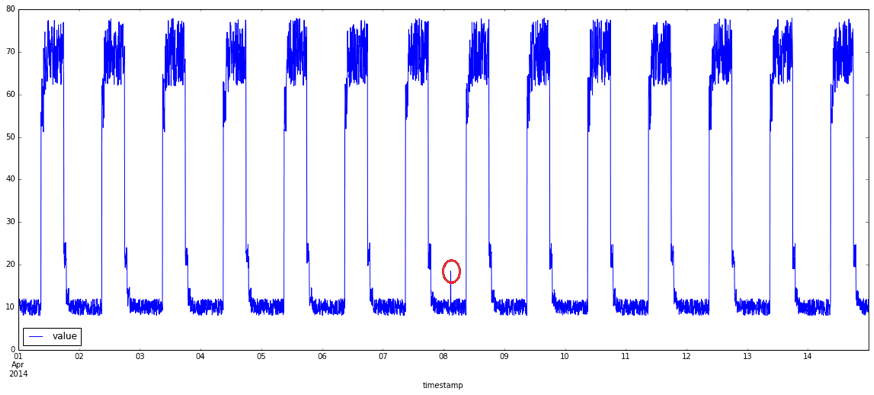
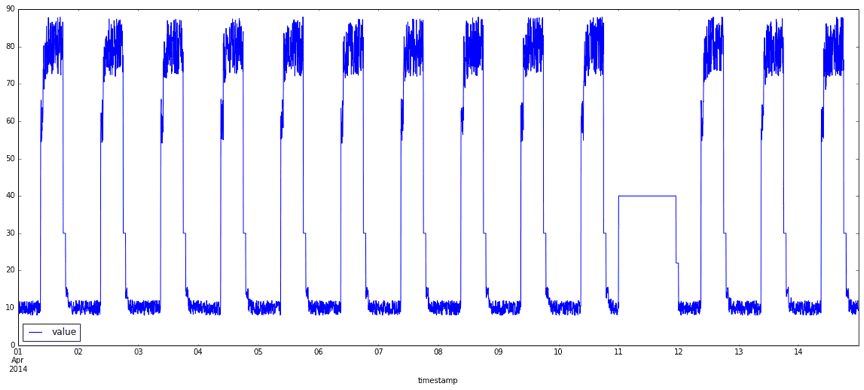
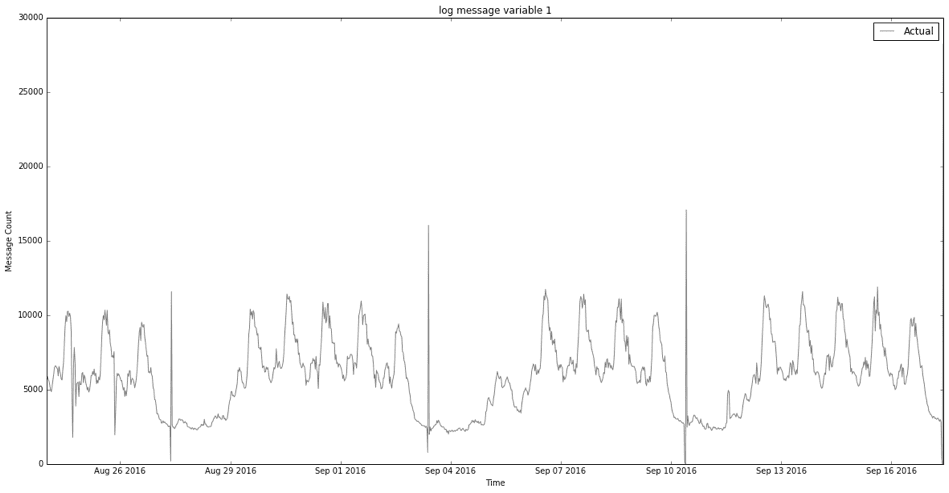
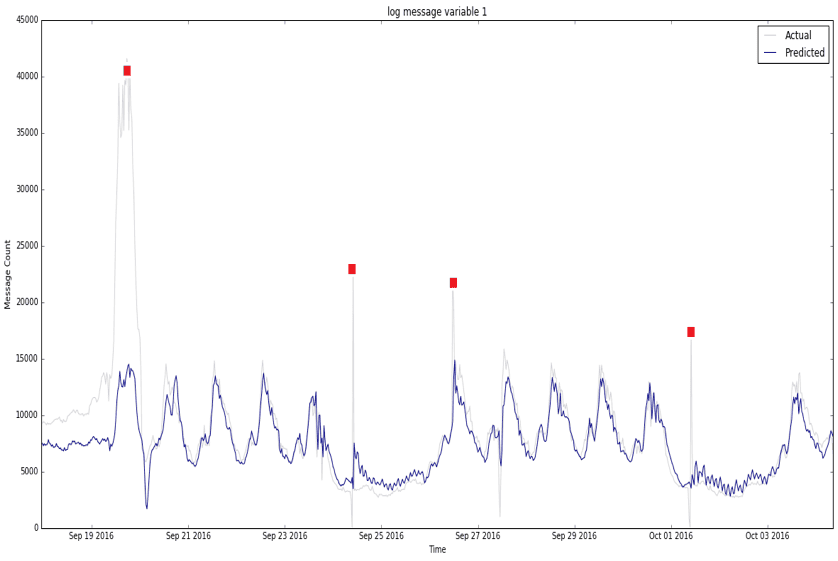
What exactly are anomalies? Simply put, an anomaly is any deviation from standard behavior. In the world of software, there are three main types of anomalies, which are depicted in the following graphs.

Figure 1 shows a normal data representation.

 normal data representation


Figure 2 illustrates point anomalies, which are anomalies in a single value in the data.

point anomalies


Figure 3 shows context anomalies, which happen when an anomalous point’s value is within the range of typical values seen so far. But when we look at the cyclic nature of the data, the point is anomalous.

context anomalies


Figure 4 depicts collective anomalies. More than a separate type, this is subsequent data that doesn’t conform to recent or frequent patterns. These anomalies are harder to define and detect.

collective anomalies

Review of Analytical Anomaly Detection

The most popular method of anomaly detection is statistical analysis, which uses a forecast model to predict the next point in the stream. Operating under the assumption that the observed data is generated by a stochastic model, statistical analysis creates data instances that are mostly normal with a few anomalies. Normal instances typically appear in high probability regions, and anomalies often occur in low probability regions of the stochastic model.

Another type of modeling is distance-based clustering. The idea here is intuitive. Anomalies are the points located farthest from the densest regions of the distribution.

Given that these both types of models are well established, we wanted to apply cutting-edge techniques to solve the problem by creating the model with no explicit feature creation or assumption about data distributions.

Machine-Learning Networks

There are two main types of networks—simple feed-forward and recurrent neural—we can use to detect anomalies. Let’s explore the results on each type of network.

Simple Feed-Forward Networks

Simple Feed-Forward Networks

Simple feed-forward networks learn from examples with no connection or relation to any two examples. That means in training a sequence of examples, the second example fed to the network has no context of the first one. What the network is learning, though, is weights Wi and Wo. (Note that the Hidden Units box in this diagram is merely representative—hidden units can have multiple layers of neurons.) The arrows are showing the forward pass of the computation. The backward pass updates the weights Wi and Wo, based on how close the calculated output is to the actual output.  

Recurrent Neural Networks

A recurrent neural network (RNN) is a special kind of neural net that has produced great results when modeling sequence data. The fundamental feature of RNNs is that the network contains at least one feedback connection, so the activations flow in a loop. RNNs also maintain a hidden state, which can learn and remember part of a previously fed training example—making them well suited to sequence prediction problems in which context (the data seen thus far) is important.

Recurrent Neural Networks


We decided to use the long short-term memory (LSTM) variant of RNN, because it’s easier to train, and it remembers more time steps than an ordinary RNN. LSTM also has input and output gates that control updates to the network’s internal memory.

The diagram below contains two inputs. One (t) is a current learning example, and the other (t-1) is the learning example which was fed just before the current one. The sequence can be longer than one, allowing the network to remember input from previous steps to provide context for the current example. This process largely mirrors that of feed-forward networks.

We used the RNN to parse the log file and convert it into counts of variables in time-frequency windows. This creates a distribution for all statistically significant log messages. Over the period, as the service cycles, these counts form patterns. Each time window can be configured so that the count is large enough to be modeled. Example frequencies range from five minutes to 30 minutes, depending on the update frequency of the logs.

We used the RNN to parse the log file and convert it into counts of variables in time-frequency windows


Once you model the variable, it looks like a sequence of counts over time.

Once you model the variable, it looks like a sequence of counts over time.


Each training example can be created by a specific time period in history. The neural network is trained to predict the next in the sequence. The general idea is to predict the message count in the next window, and compare it to the actual output. If the deviation exceeds the threshold percentage, it’s an anomaly.

The neural network is trained to predict the next in the sequence


Once you have the data in the correct form, it’s time to figure out the layers of the network, tune the parameters, and see what works best. We used a deep network with more than 36 LSTM cells to model the problem. We also experimented with training the network in batch and online modes.

Here is the data on which the network is trained:

The data on which the network is trained


And here are the sample results of prediction:

Sample results of prediction


Predictions are plotted in blue, and actual results are in gray. Anomalies are highlighted where predictions differ from actual results by a large margin.

Summary

System-generated logs contain information showing the cyclic nature of the system, which can then be modeled as a continuous time series. The advances of recurrent neural networks have made it possible to learn data patterns in noisy time series. RNNs can be used to detect anomalous behaviors, and by adding machine learning intelligence, teams can control how to monitor their data. Since anomaly limits aren’t hard-coded, this opens up a number of exciting possibilities for SaaS and cloud operations teams to detect anomalies that can identify threats like ransomware.

Recommended Resources: Druva 2017 VMware Cloud Migration Survey