Enterprise SaaS platforms live and die on dashboard performance. When an administrator opens a multi-tenant control plane to check backup compliance or disaster recovery status, every second of lag is a second of eroded trust, and at scale, lag compounds into something worse.
Earlier this year, one of our engineers was profiling the All Organizations page and noticed something that shouldn’t have been possible: a tenant with 80 organizations was generating close to 800 API calls the moment the page opened. Not on scroll. Not on interaction. Immediately, all at once, before the user had moved the mouse.
The page looked fine. Users weren’t filing tickets. But the numbers told a different story, and at larger tenant sizes, that story was going to get expensive fast.
What the page was actually doing
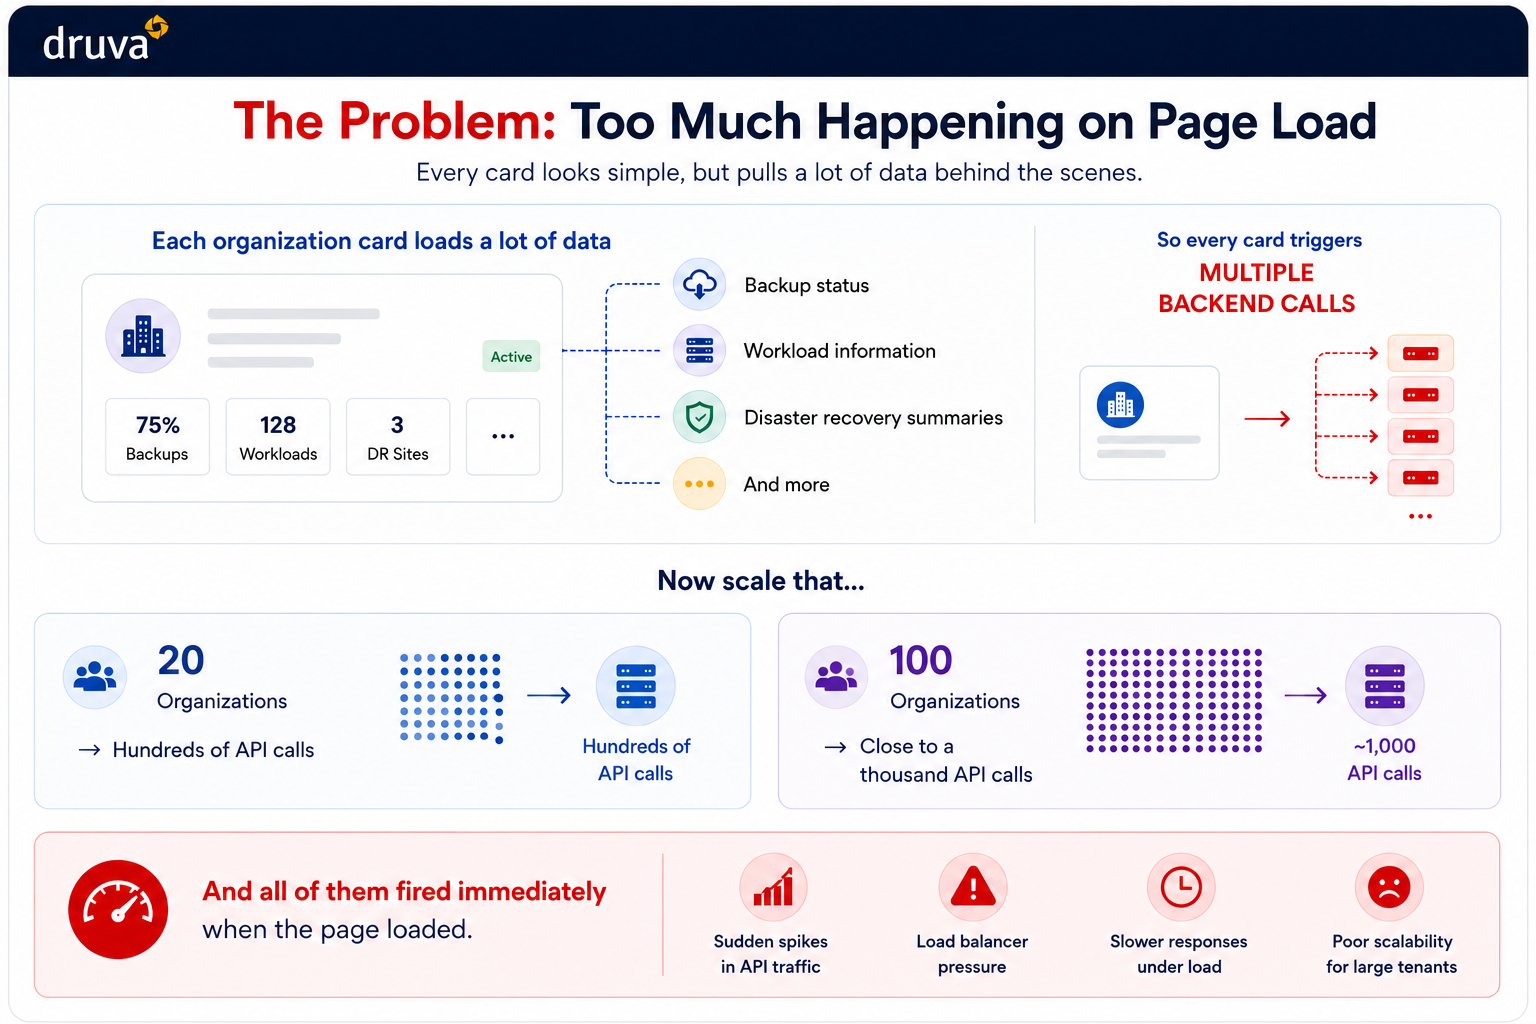
Each organization card on the All Org page surfaces a real-time snapshot of tenant health: backup compliance status, active workload metrics, disaster recovery readiness. That’s ten or more backend calls per card, every time the page initializes.
The problem wasn’t the data — that information is genuinely useful and belongs there. The problem was the timing. Every card fired its requests simultaneously on page load, including cards nowhere near the visible viewport.
On a standard display, users see two or three organization cards at once. Our system was loading data for all of them regardless. The math gets uncomfortable quickly:
20 organizations → ~200 API calls on load
100 organizations → ~1,000 API calls on load
All concurrent. All hitting the load balancer at the same moment. At smaller tenant sizes, this was invisible. At enterprise scale, it created measurable latency spikes, and the problem scaled linearly with tenant size, which meant it was only going to get worse as customers grew.