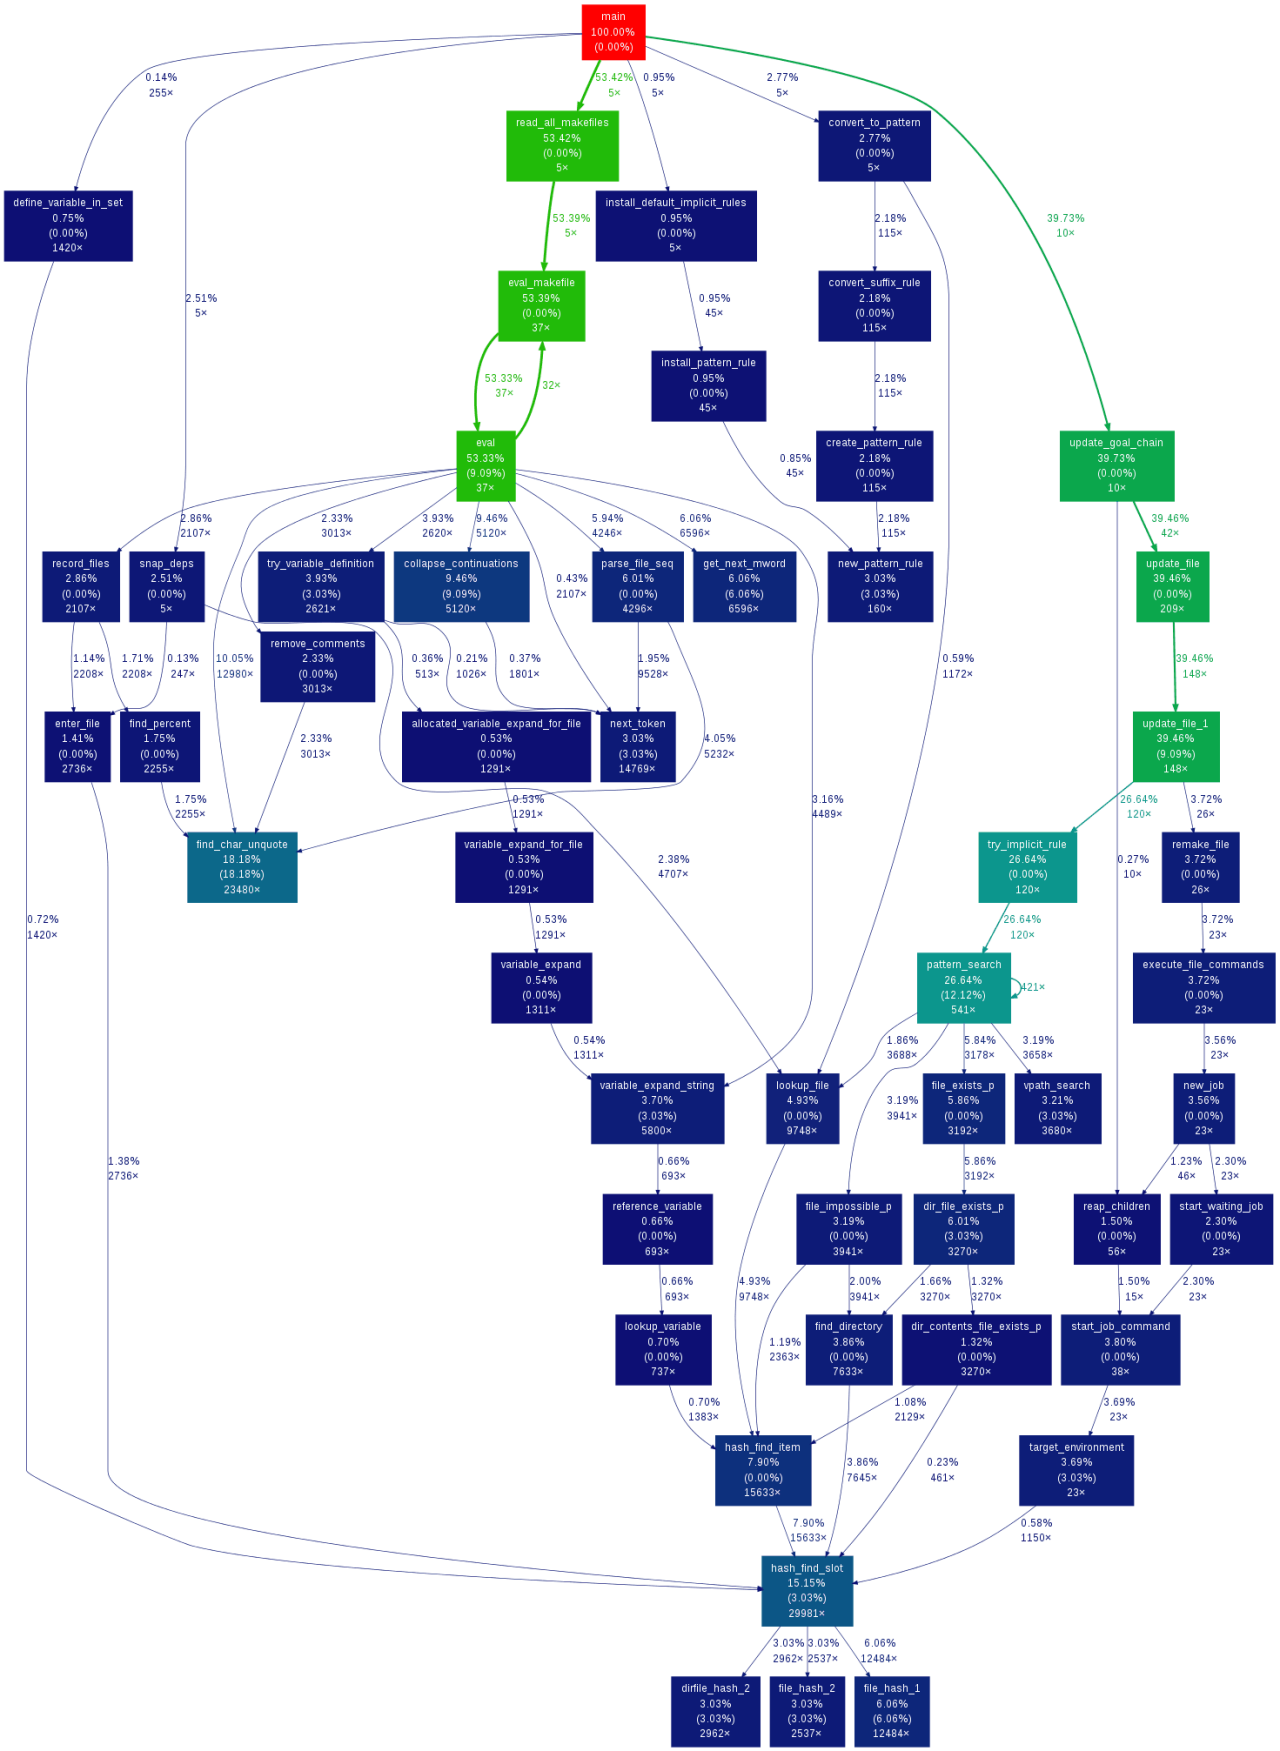
The graph shows top down hierarchy of functions, the percentage of time each function consumes, the number of calls etc. The percentage of time consumed by a function puts the performance optimization exercise in the right perspective. You don’t want to optimize a function if it contributes just 1% to the whole processing time. The general idea is to concentrate on function that consumes substantial time and is not supposed to do it. Once a few functions like this are optimized, you can go for another round of profiling.
Network Utilization
It’s not sufficient to just reduce the network bandwidth usage. It’s equally important to completely utilize your share of the network bandwidth.
Especially for non-interactive applications, the throughput matters much more than the latency. In a system that uses a single threaded client to issue RPC calls, thethroughput is governed by the latency. If one RPC call takes a long time, the throughput is low even though there is no bottleneck, persay. Looking at it in a different way, the network is not being utilized when the server is processing the call. A multi-threaded client improves network utilization and also throughput. Sometimes the cause for poor network performance could be outside your code. For example, the TCP default window size shows poor performance with high latency-high bandwidth network. Increasing TCP window size improves performance for such networks and so does the use of multiple TCP connections.
Caching
Caching frequently used data reduces the database queries or disk reads. Database queries and disk reads may not consume the CPU cycles but they add to the latency in a big way.
Multi-threading
Multi-threading can work around latency but it comes with its own overheads in terms of code complexity and resource consumption. Simple caching avoids frequent trips to database/disk. Databases and operating systems maintain their own cache but the overheads of connecting to a database or issuing a system call are avoided at best.
Beware of stale caches and serialization issues.
Delayed Writes
Synchronous writes are slow. Some writes, for example activity logs, can be delayed indefinitely. Other writes that need persistance gurantees can be synced in batches than individually.
This holds true for both databases and file systems. It’s cheaper to do multiple inserts in one sqlite transaction than to create one transaction for each insert. On the file system side, you are better off writing a few MBytes to a file, followed by a fsync than multiple few KBytes of writes and a fsync for each write.
Batch requests
A batch of 10 queries sent to a database works faster than 10 queries issued one after the other. Encoding the 10 queries as a pl/sql function works even better. This is primarily due to the socket communication overheads, specifically the latency involved in it.
For inSync 2.1, we found that the lowest hanging fruits were with the database and file system interactions. We sure plucked all of them.